Have you ever watched a currency pair for hours, waiting for it to form a clear support or resistance level? The price is tight, has a large volume, and then it breaks out. At this point, you enter the trade thinking that it is the right entry. But then, something unexpected happens, i.e., the price reverses, right back into the range. And sadly, hits the stop loss level.
If this sounds familiar, then you have likely experienced a false breakout. It is one of the most common and frustrating situations in forex trading. That is why it is important to learn how to distinguish between a true and a false breakout. In this blog, we will discuss how to identify them more effectively.
What is Breakout Trading Strategy?
It is a trading technique in which traders get into a trade when the price moves away from a support or resistance level. Here, traders expect that the price will continue to move in that direction. In simple terms, once a key level is breached, the market structure will alter, and a new trend will start.
Breakout trading strategy one of the most widely used strategies as it offers clear entry points, defined risk, and the potential to catch a trend right from the start.
Why do breakouts happen?
First, you need to understand that no trend can continue forever for any currency pair. Instead, they approach each other in a sideways movement within a range as buyers and sellers reach a temporary balancing point. Both sides are subject to increasing pressure during this time. Ultimately, one side or the other will take control and the price will eventually break out of this range with strong momentum.
This breakout shows a change in market sentiment. It indicates that one of the sides has become dominant. Breakout trades want to grab this momentum as early as possible, prior to the new trend taking form.
But not all breakouts are real. Markets have a lot of noise. Price tends to get pushed above or below a key level, trigger stop orders and reverse right back. The key is to understand the difference between them.
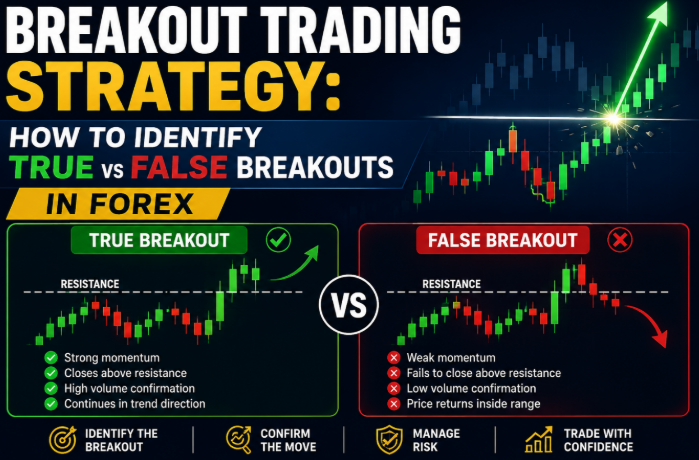
How to Identify a True Breakout Pattern?
The following are some of the key elements of a True Breakout Pattern:
- Strong and decisive candle close: If the long wick comes into contact with the level and retracts, it’s a serious warning. If possible, look for a full-bodied candle that can be safely extinguished.
- Volume confirmation: In Forex, volume is not as clean as in stocks (Volume Confirmation). However, the Volume indicator and tick volume are good alternatives. Typically, a healthy breakout would be a huge escalation of activity. Low-volume breaks are much more likely to fail, especially if they are thin.
- Retest of the broken level: After a breakout, the price will retest the broken level and stay. What was previously resistance is now becoming the support, and vice versa. This retest is one of the cleanest entry levels in all forex trading strategies due to its clear retest invalidation level and low-risk entry level.
- Breakout aligns with the overall trend: A breakout in the direction of the higher time frame trend is far more significant, as it is in accordance with the overall trend. When the price action breaks out of the consolidation and moves higher on the time frame, it is more likely that things will continue to go higher, as a bullish daily chart pattern would suggest.
How to Identify a False Breakout?
False breakouts, also called fakeouts, have their own signs. Some of them are:
- Breakout on low volume: If the price breaks above a significant price level, but there is no significant volume, then be careful. The move just doesn’t come from a place of conviction.
- Immediate reversal after the break: A true breakout will always hold. A false one reverses quickly, often within one or two candles. If price surges over a price level and then immediately reverses with a strong bear candle, it’s a red flag.
- Break against the higher timeframe trend: counter-trend breakouts are more likely to fail. When the daily trend is bearish, but the price action has been making higher highs on the 15-minute chart, this is a big red flag.
- Break near major news events: Economic data releases and central bank announcements generate very sharp and erratic moves, which can be intrusive, but with no apparent direction. A lot of these “breakouts” are nothing but a moment in time.
Practical Tools to Filter Out False Breakouts
Apart from the price action analysis, there are some tools that traders can use to enhance accuracy:
- Average True Range (ATR) to measure volatility. If the breakout candle is not significantly above the average range, then it is a weak breakout candle. You need to get a sense of conviction in the size of the move.
- Bollinger Bands: If the price moves strongly out of the bands and the bands are widening, it lends credibility to the move.
- Multi-timeframe analysis: Before considering a breakout on a lower time frame, confirm this trend on a higher time frame. The 15-minute breakout confirmed on the 1-hour chart is more reliable than the 15-minute breakout by itself.
- Always wait for the candle to close: This is the easiest filter and is frequently the best. Don’t break the candle in the middle. Wait for confirmation via a full close beyond the level.
Conclusion
The Forex Breakout Trading Strategy is one of the most profitable ways to trade Forex, but you have to be able to find out if the breakout is real or fake. The key to mastering the breakout trade is strong closes, volume confirmation, higher time frame alignment, and the ability to wait for a retest.